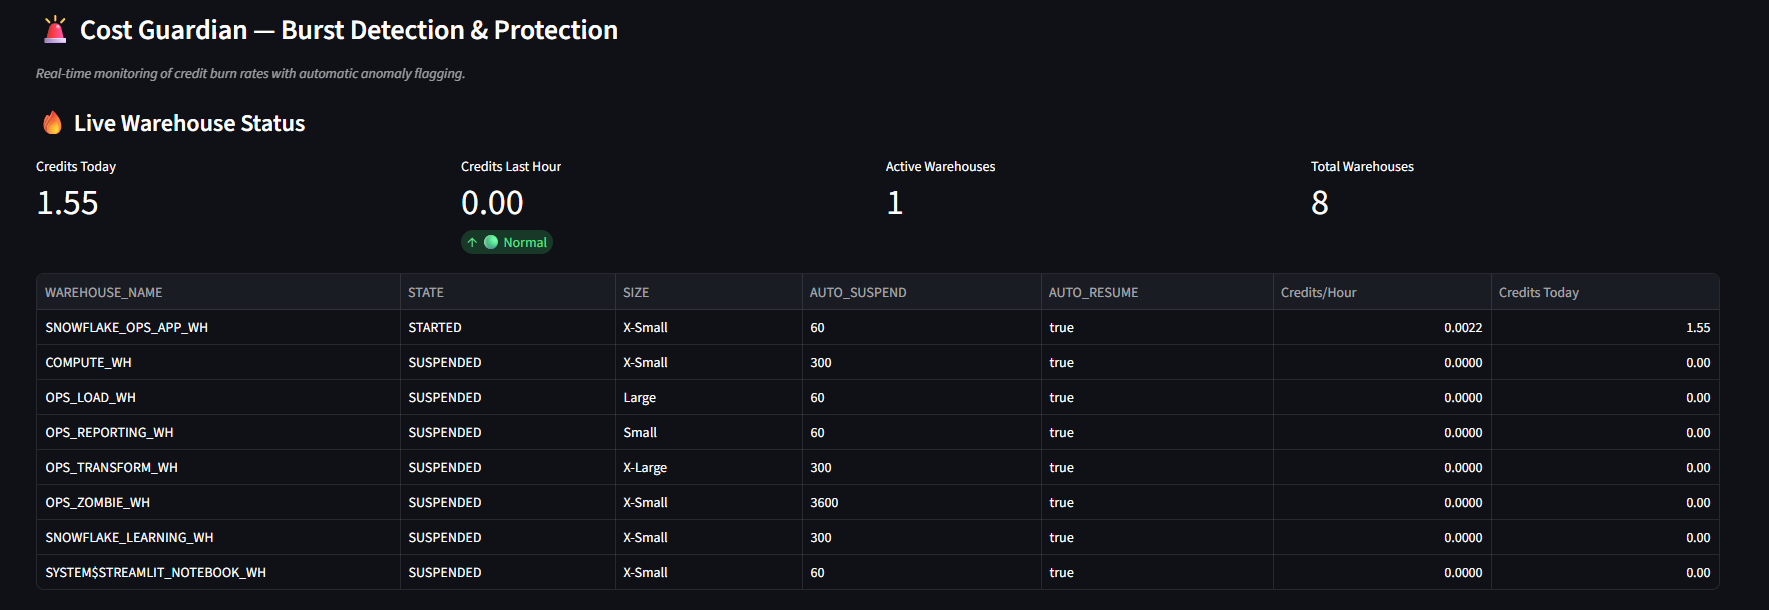
← Back to Home

Every dashboard, every detail

19+ dashboards across cost intelligence, query optimization, security governance, warehouse management, and AI-powered analytics. See exactly what you get.

💰 Cost Intelligence

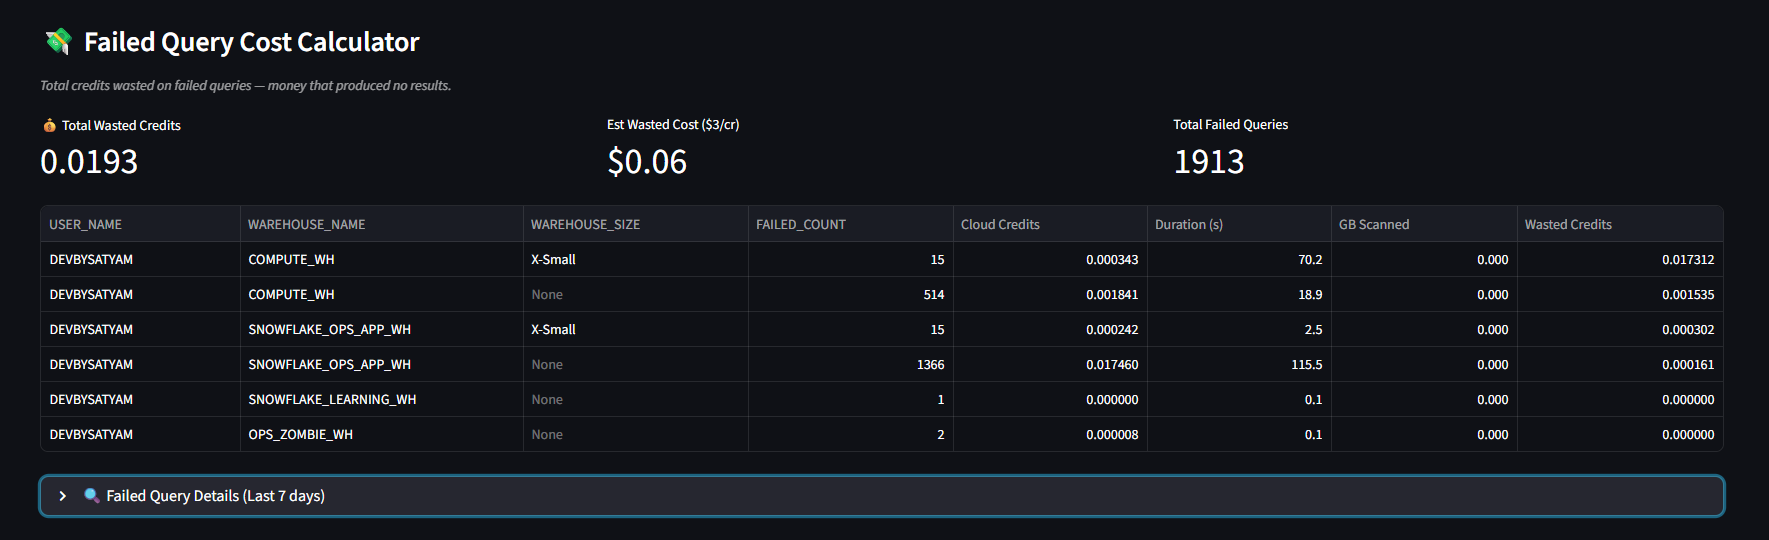
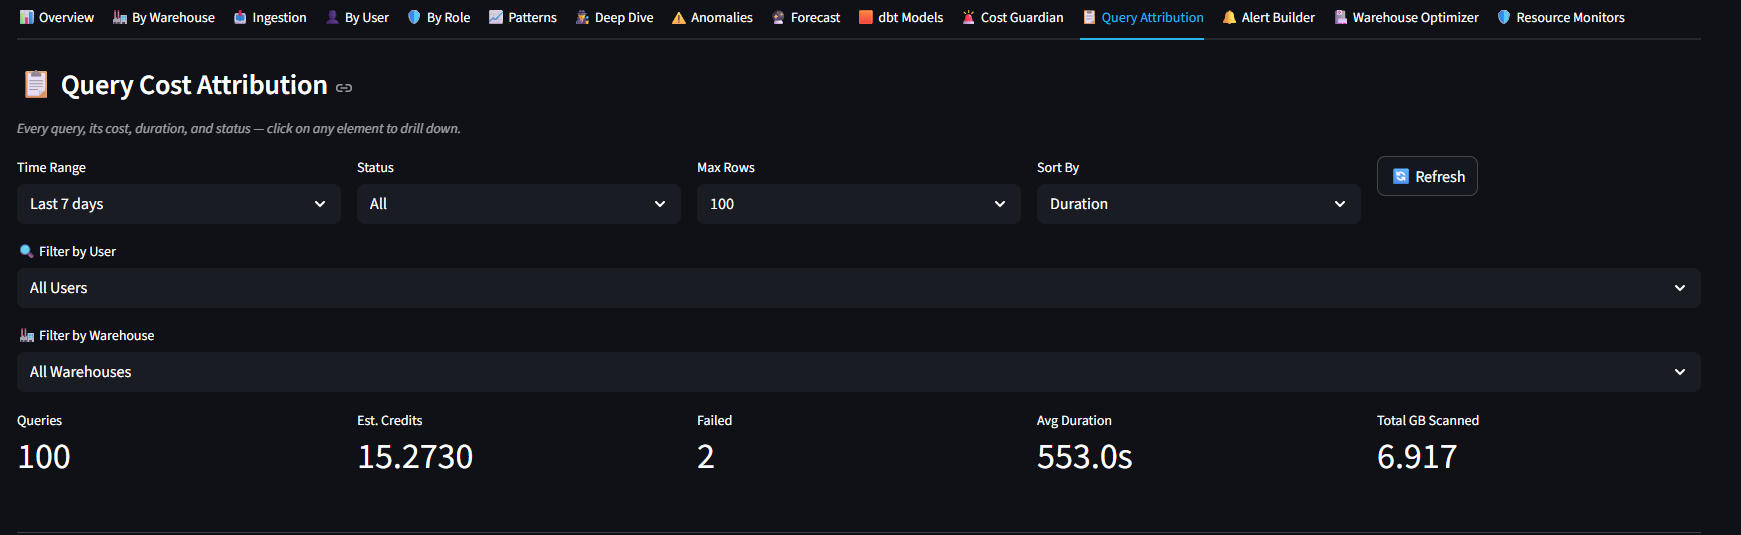
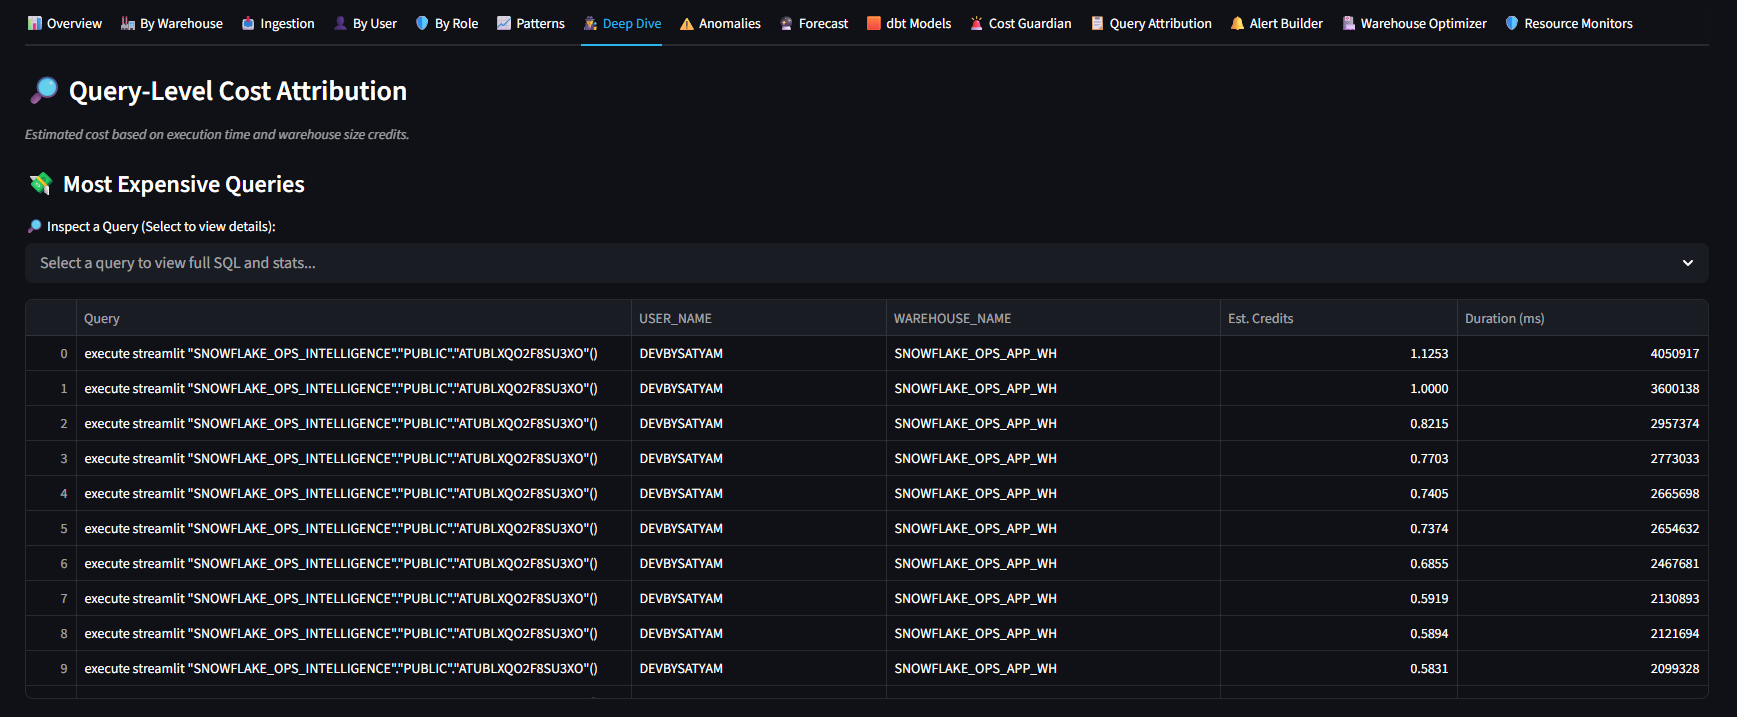
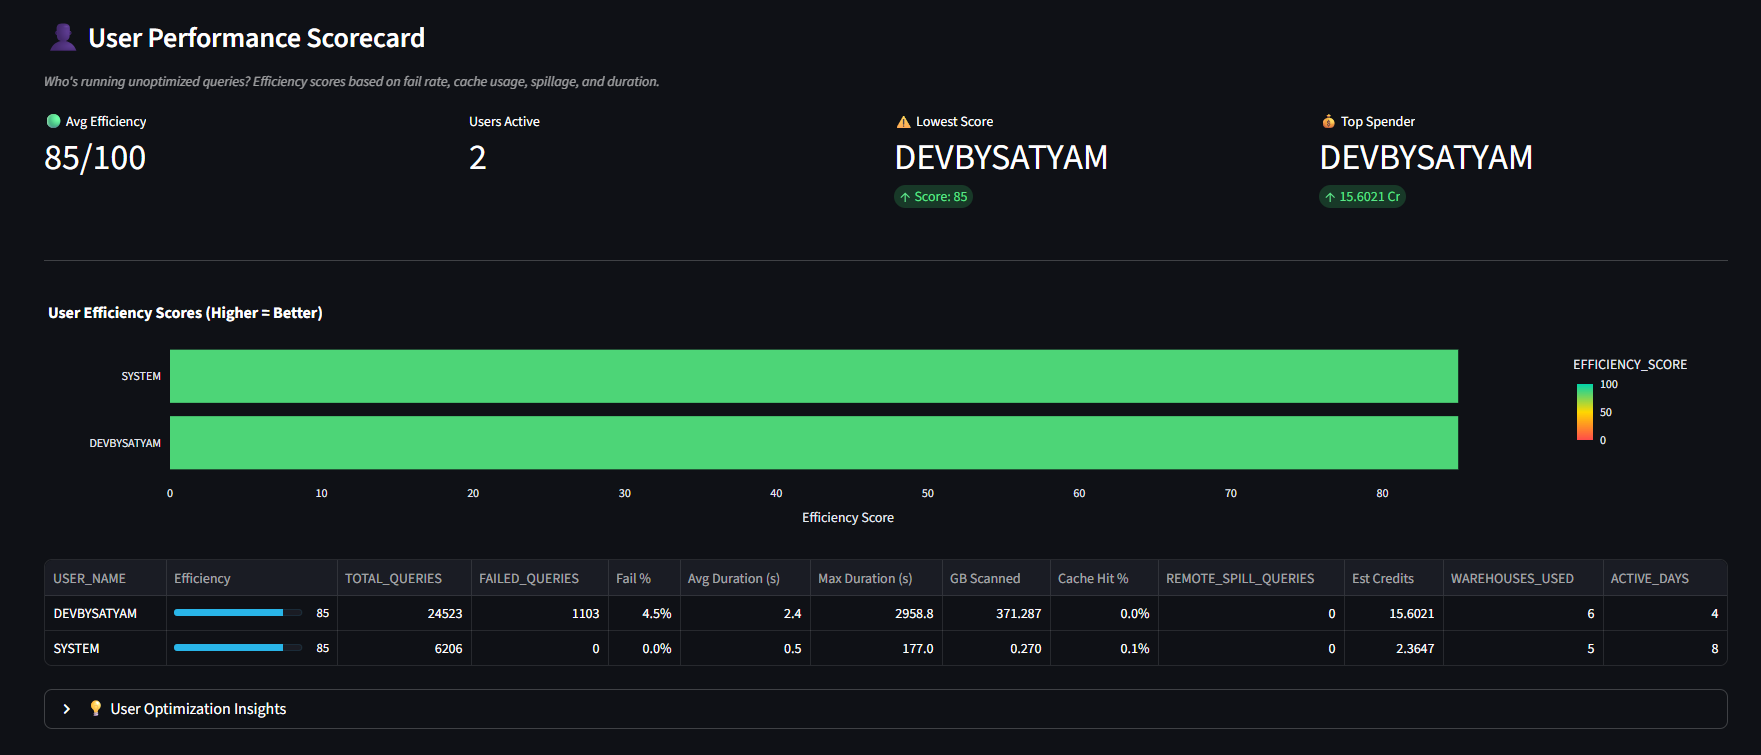
Real-time visibility, attribution, and cost optimization insights across 15 sub-tabs.

  • Overview with total credit consumption
  • By Warehouse breakdown with trends
  • Ingestion costs (Snowpipe and COPY)
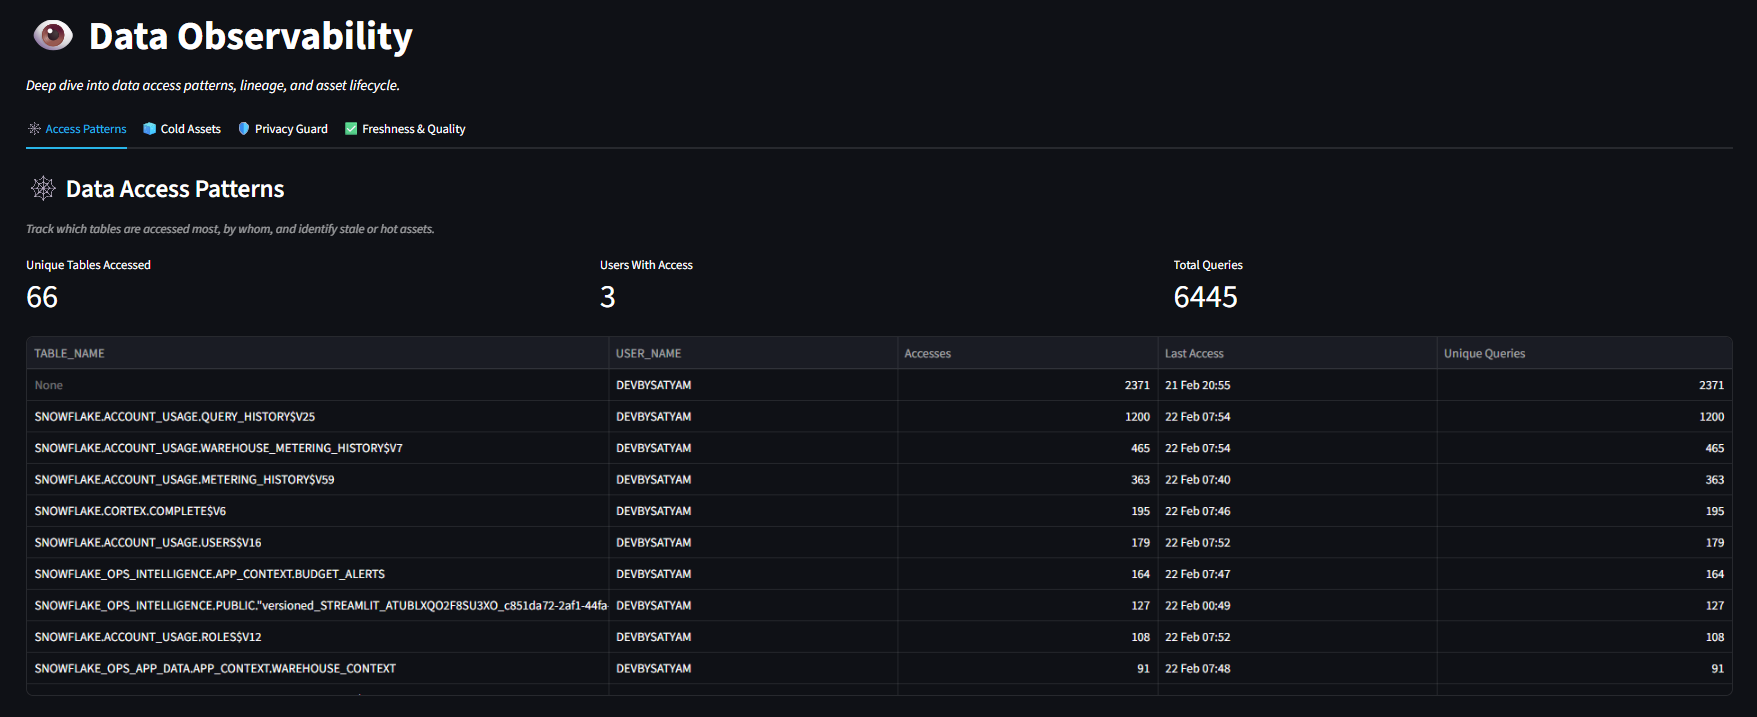
  • By User attribution with data scanned
  • By Role cloud credits allocation
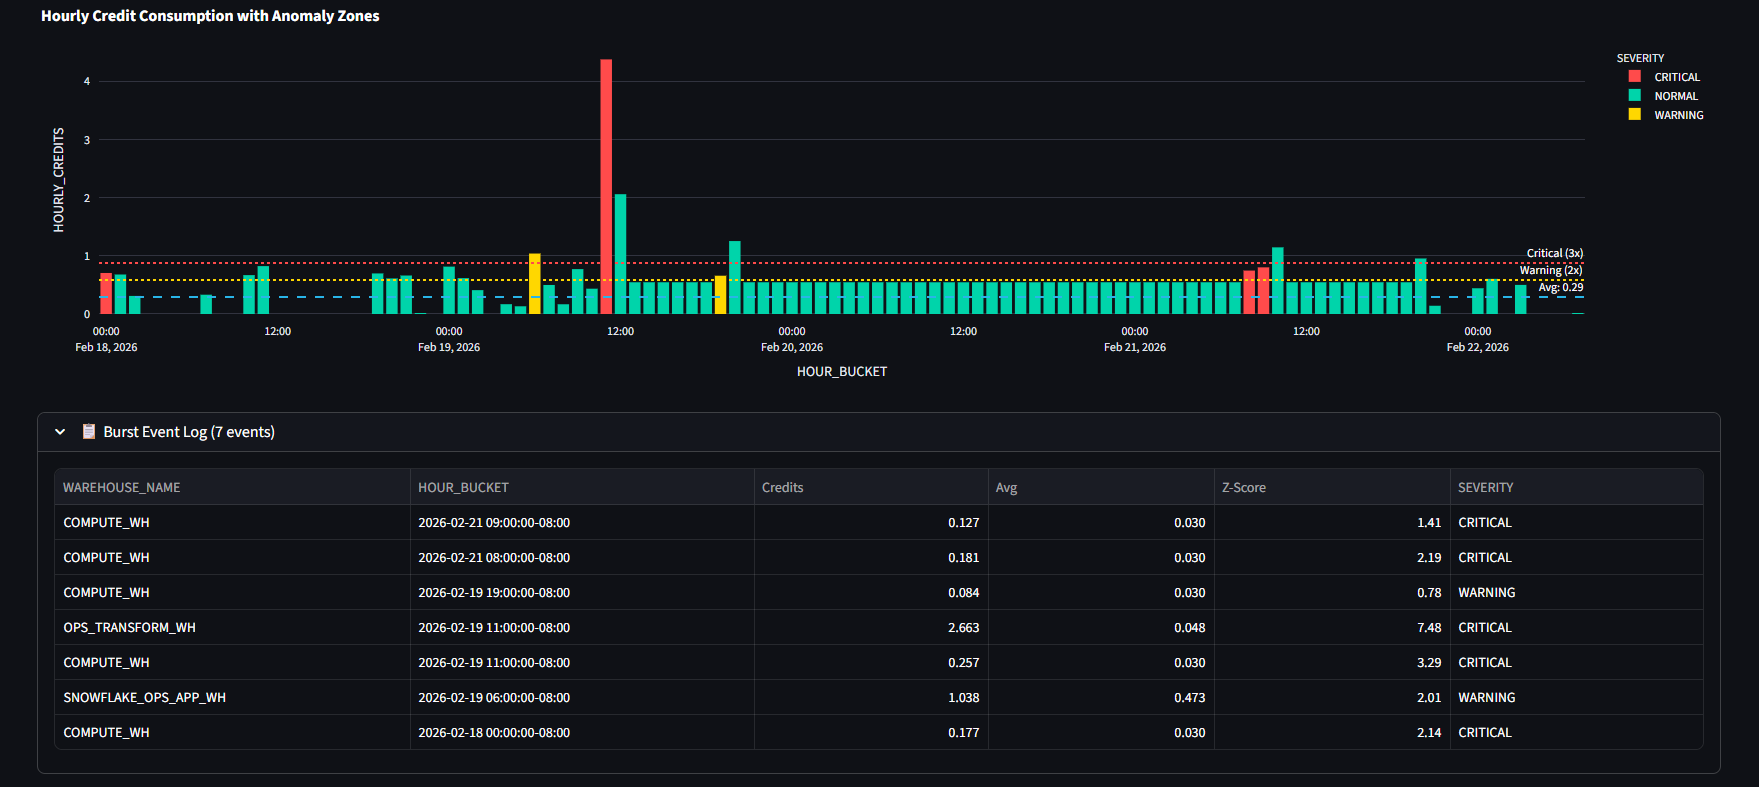
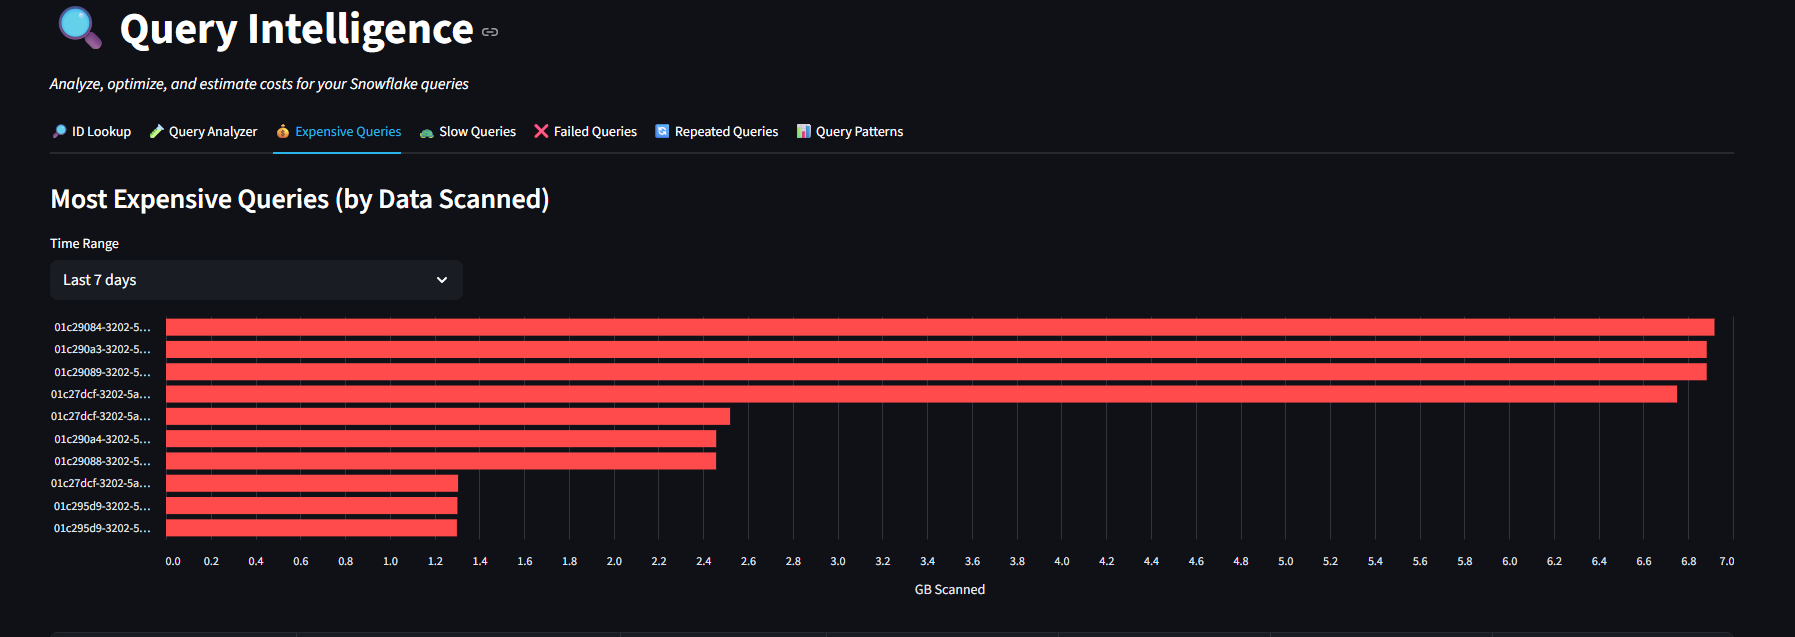
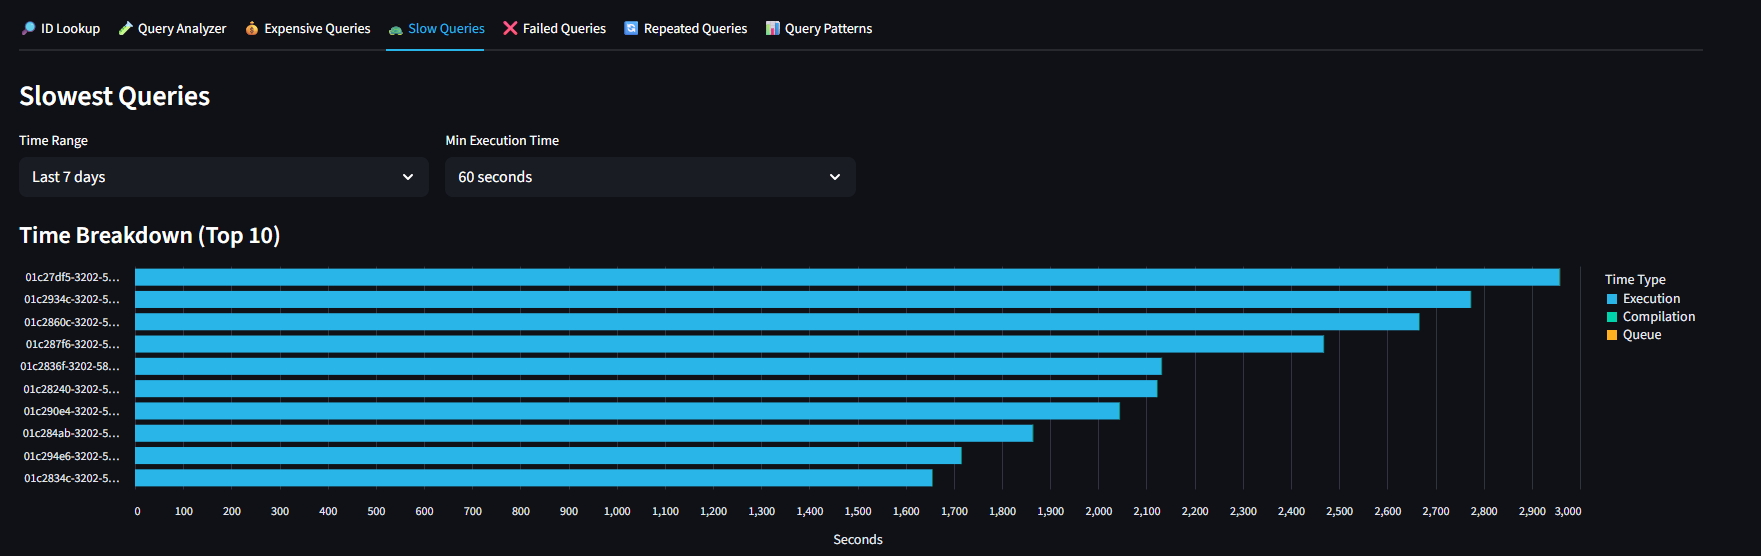
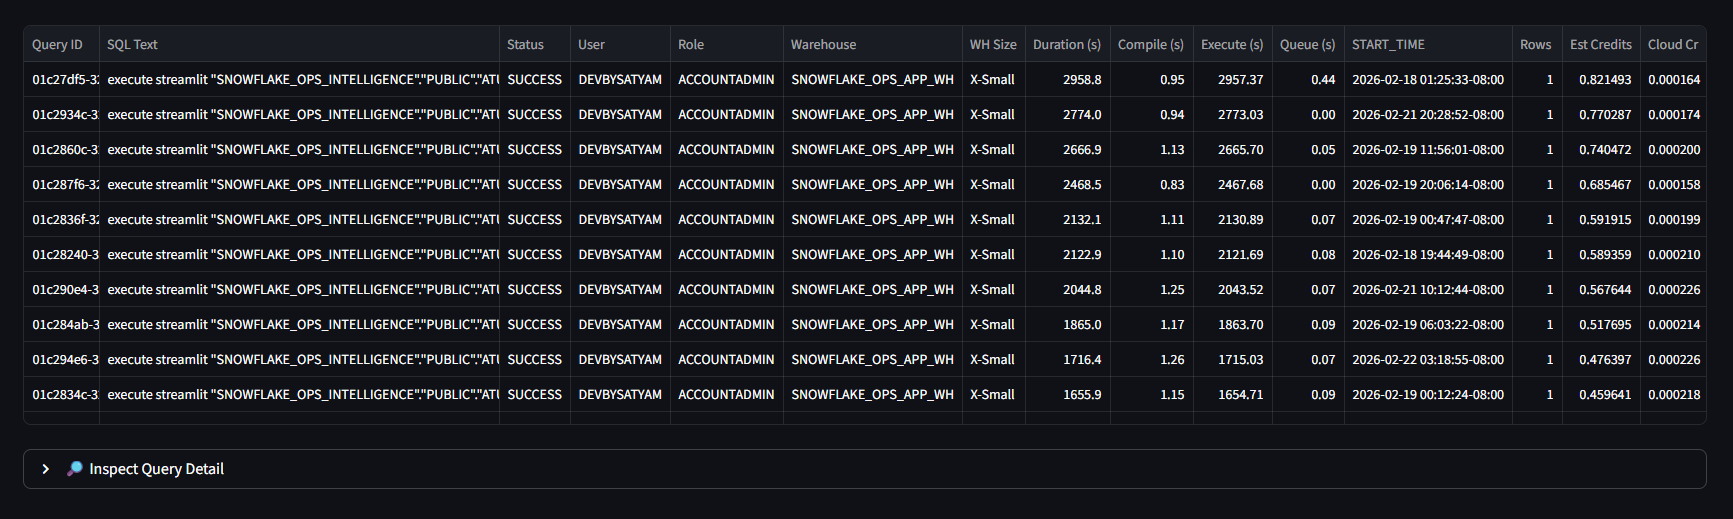
  • Query Patterns and anomaly detection
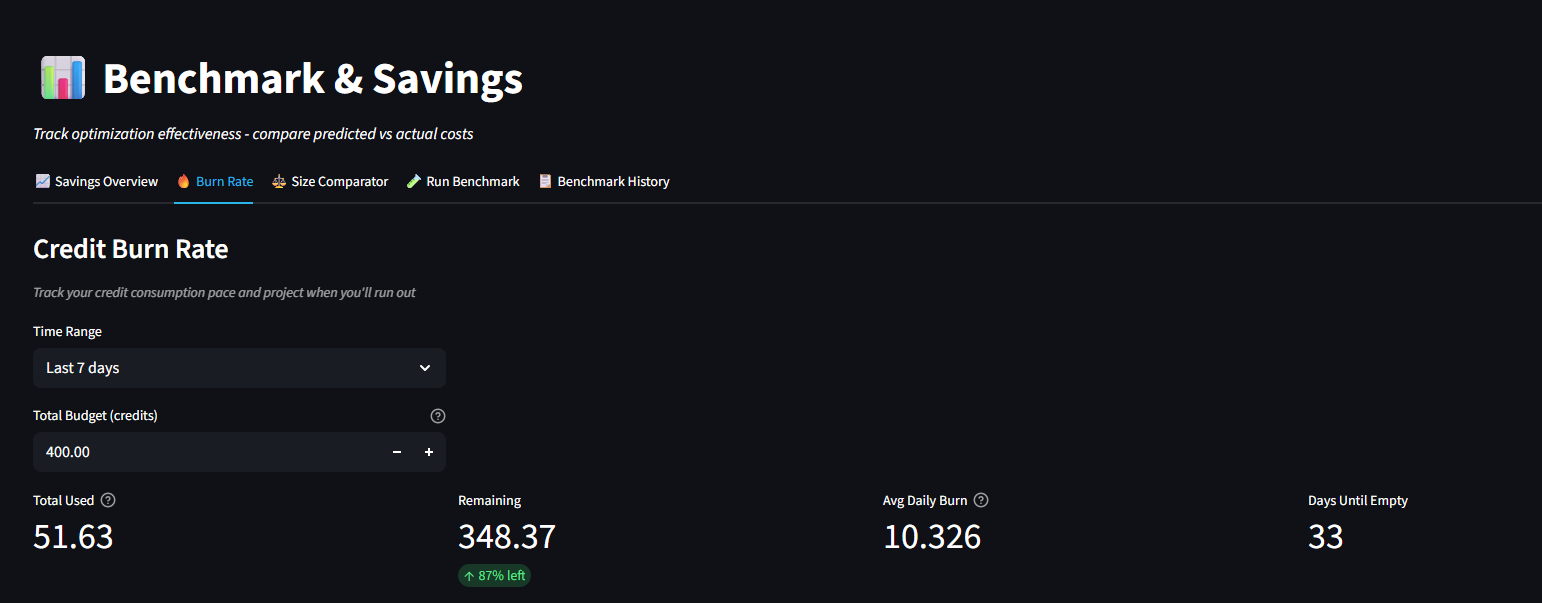
  • Scenario Forecasting with budget runway
  • dbt Model cost tracking
Dashboard Overview
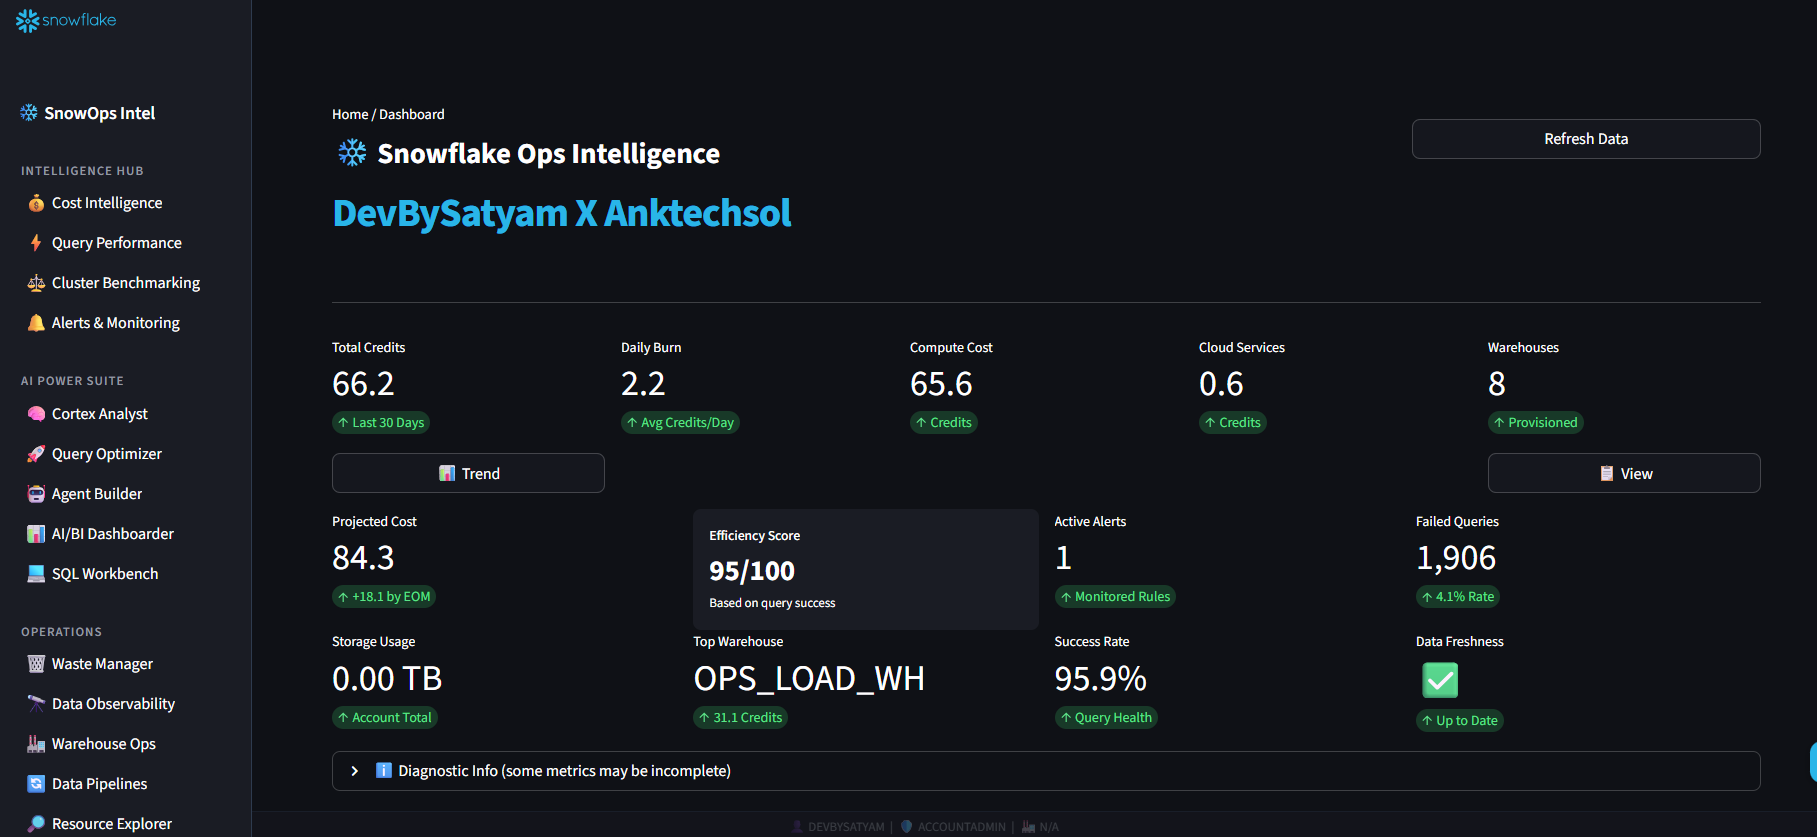
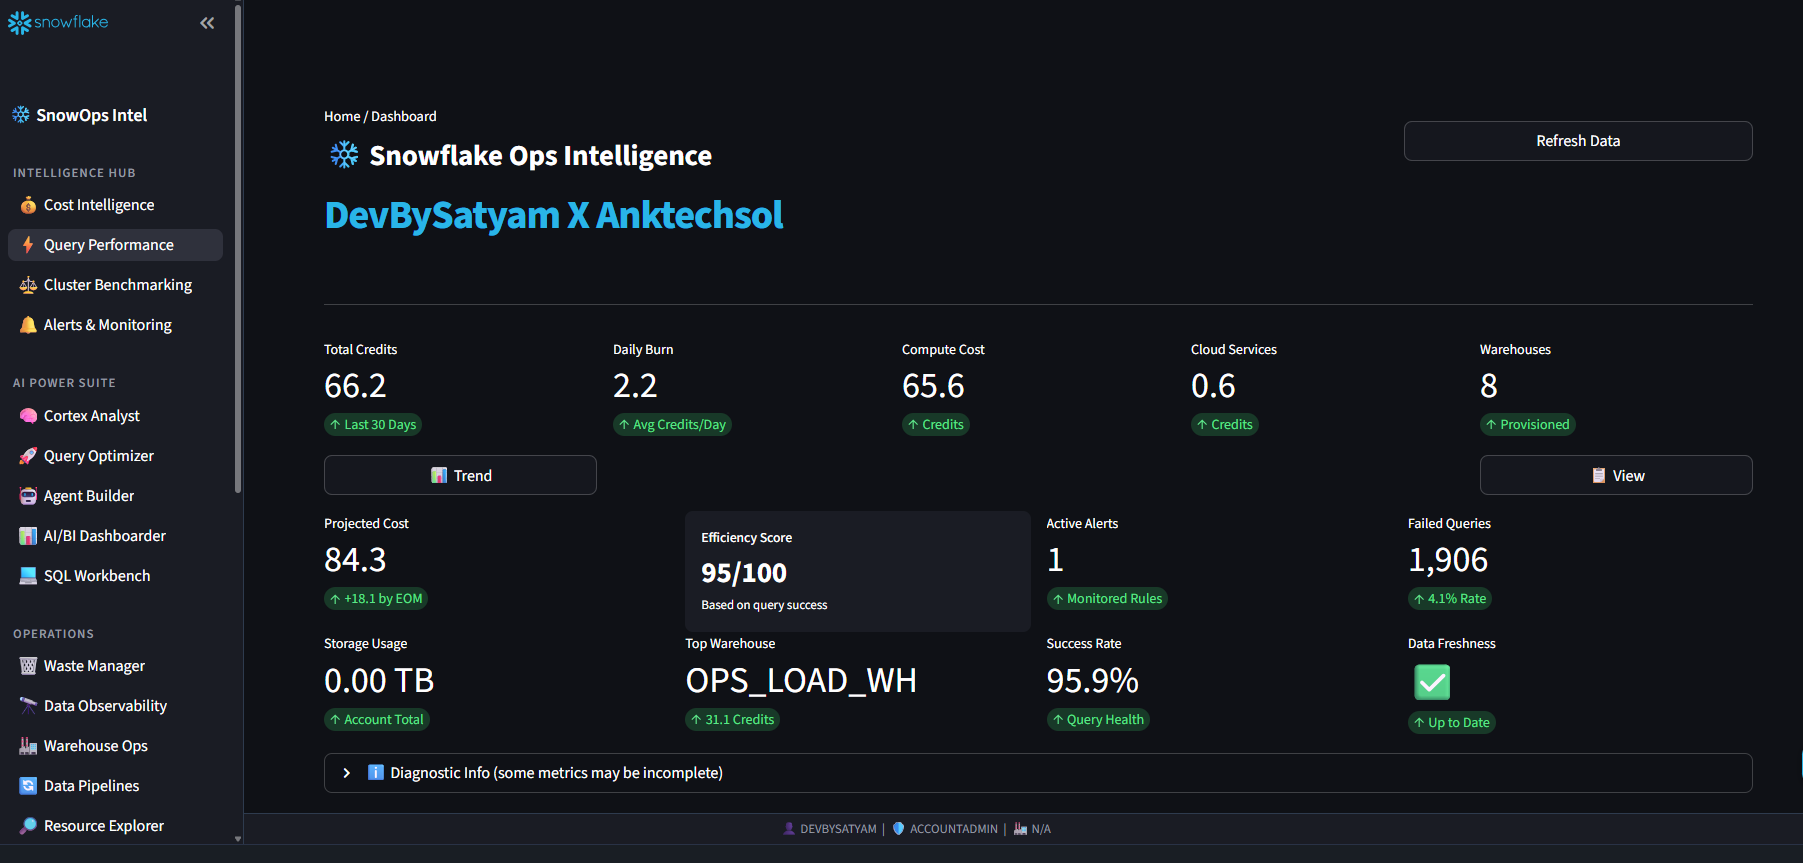
Overview — Total credits, daily burn rate, top warehouses
Cost by Warehouse
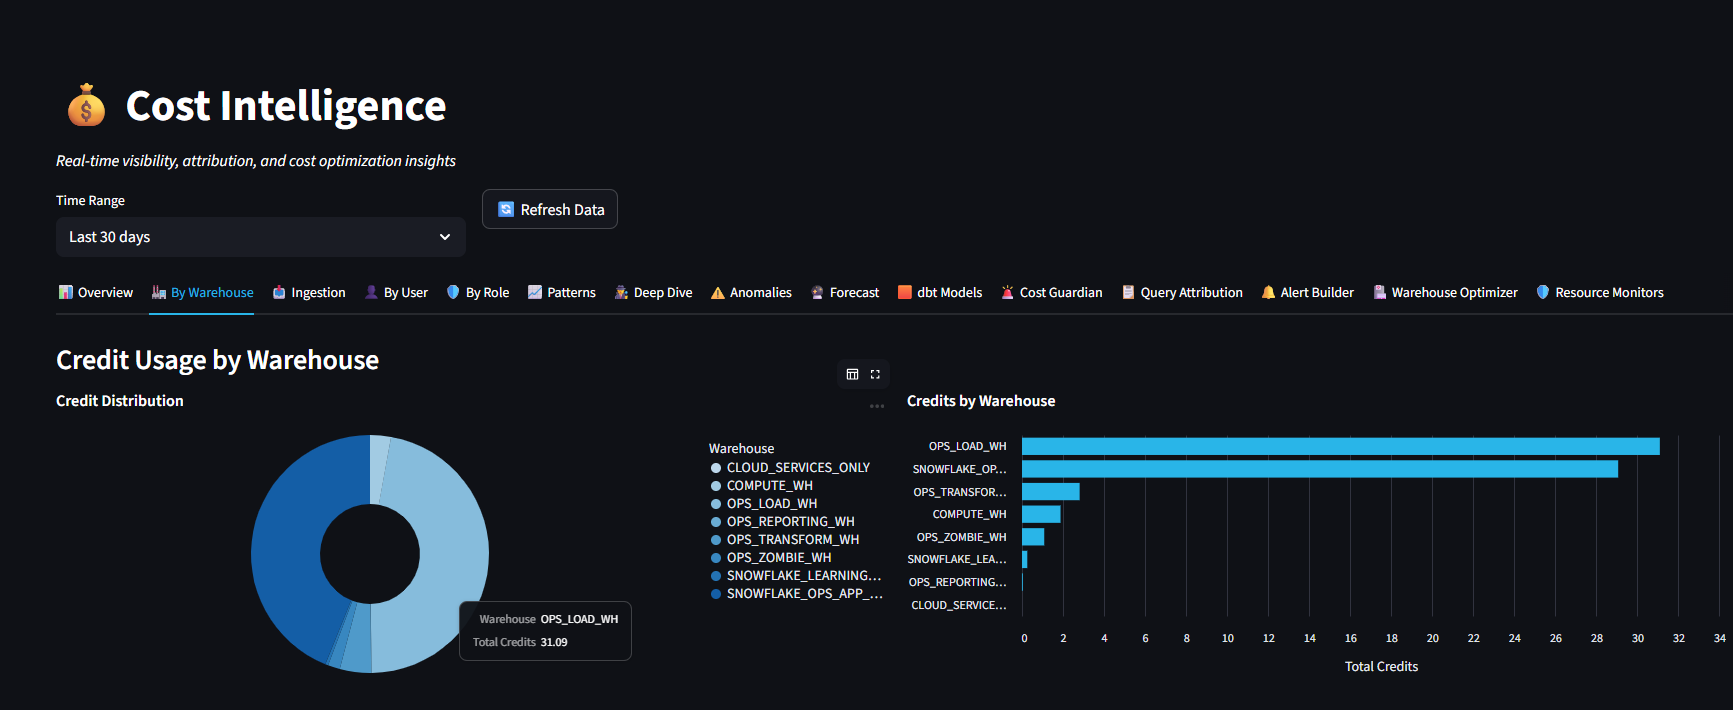
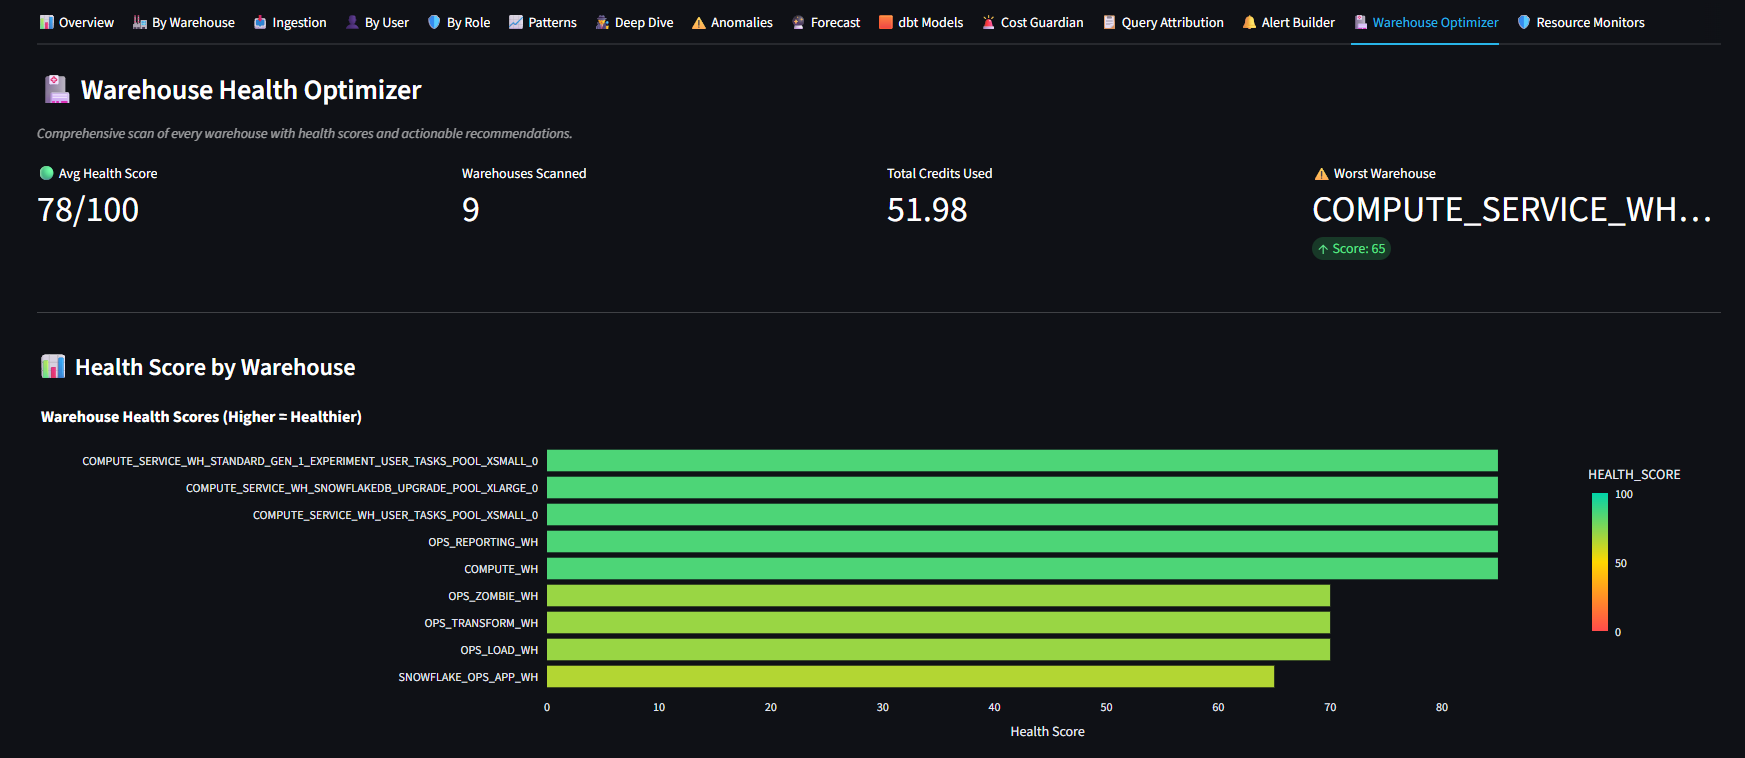
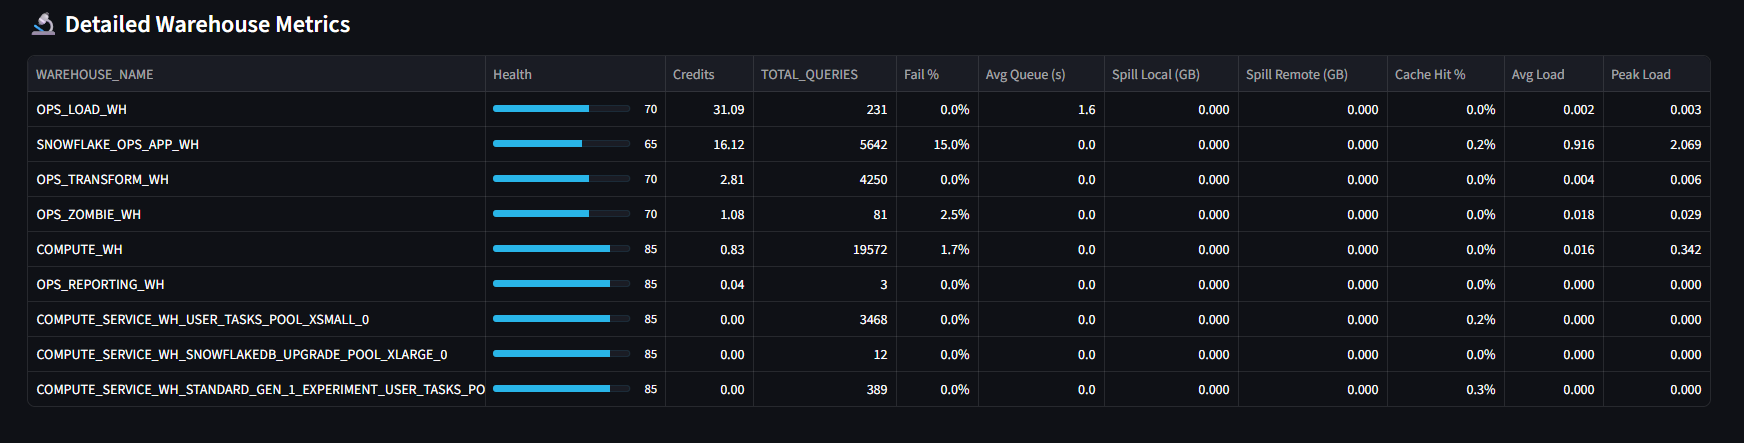
By Warehouse — Credit consumption per warehouse with sidebar navigation
Ingestion Costs
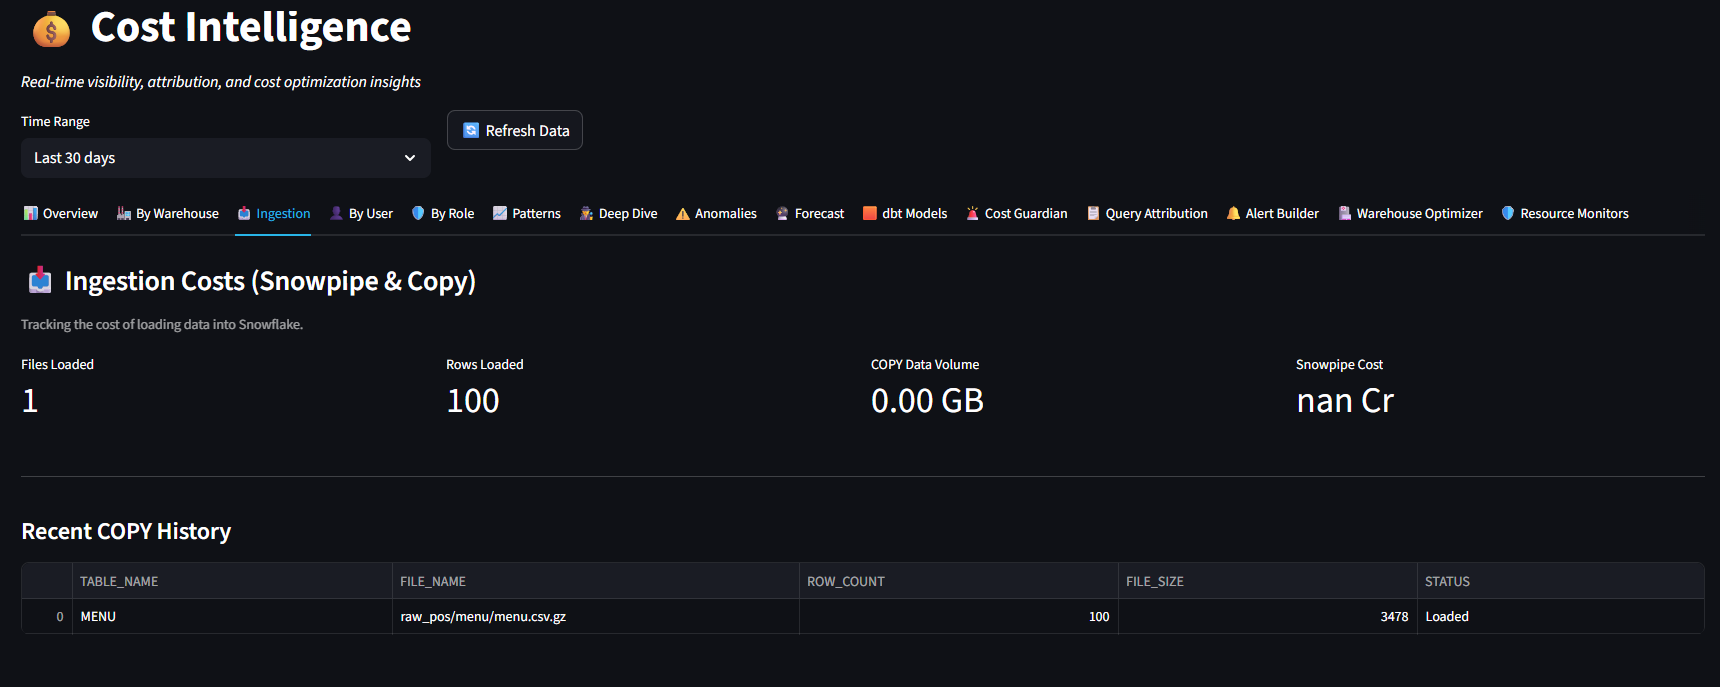
Ingestion — Snowpipe and COPY operation costs, files loaded, rows loaded
Cost by User
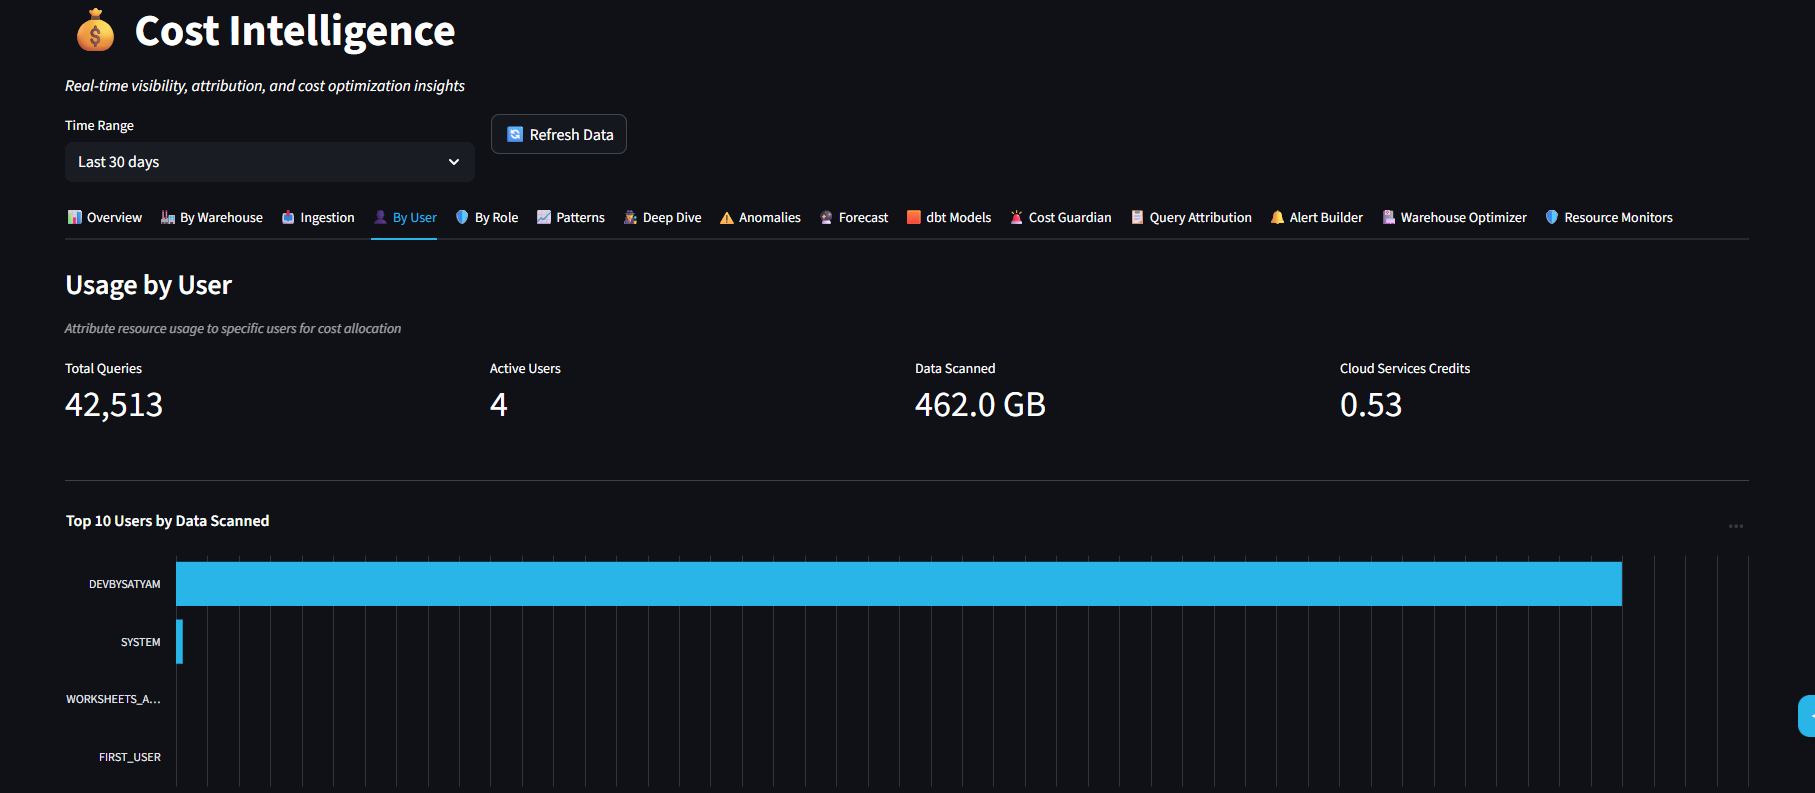
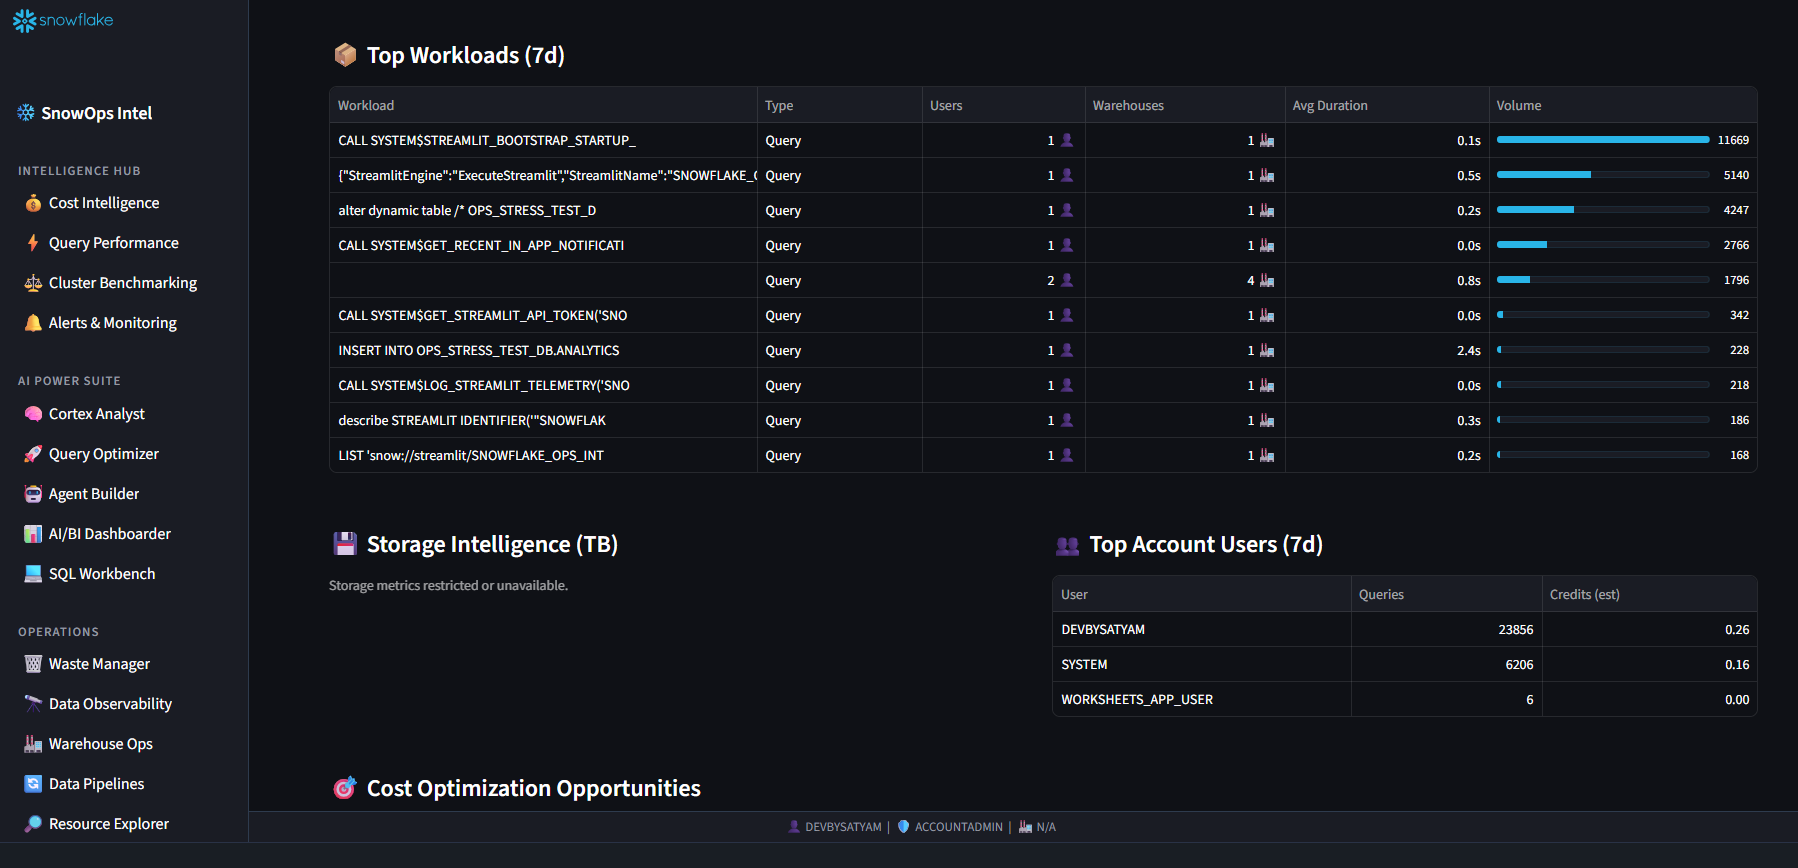
By User — 42,513 total queries, 462 GB scanned, per-user data breakdown
Cost by Role
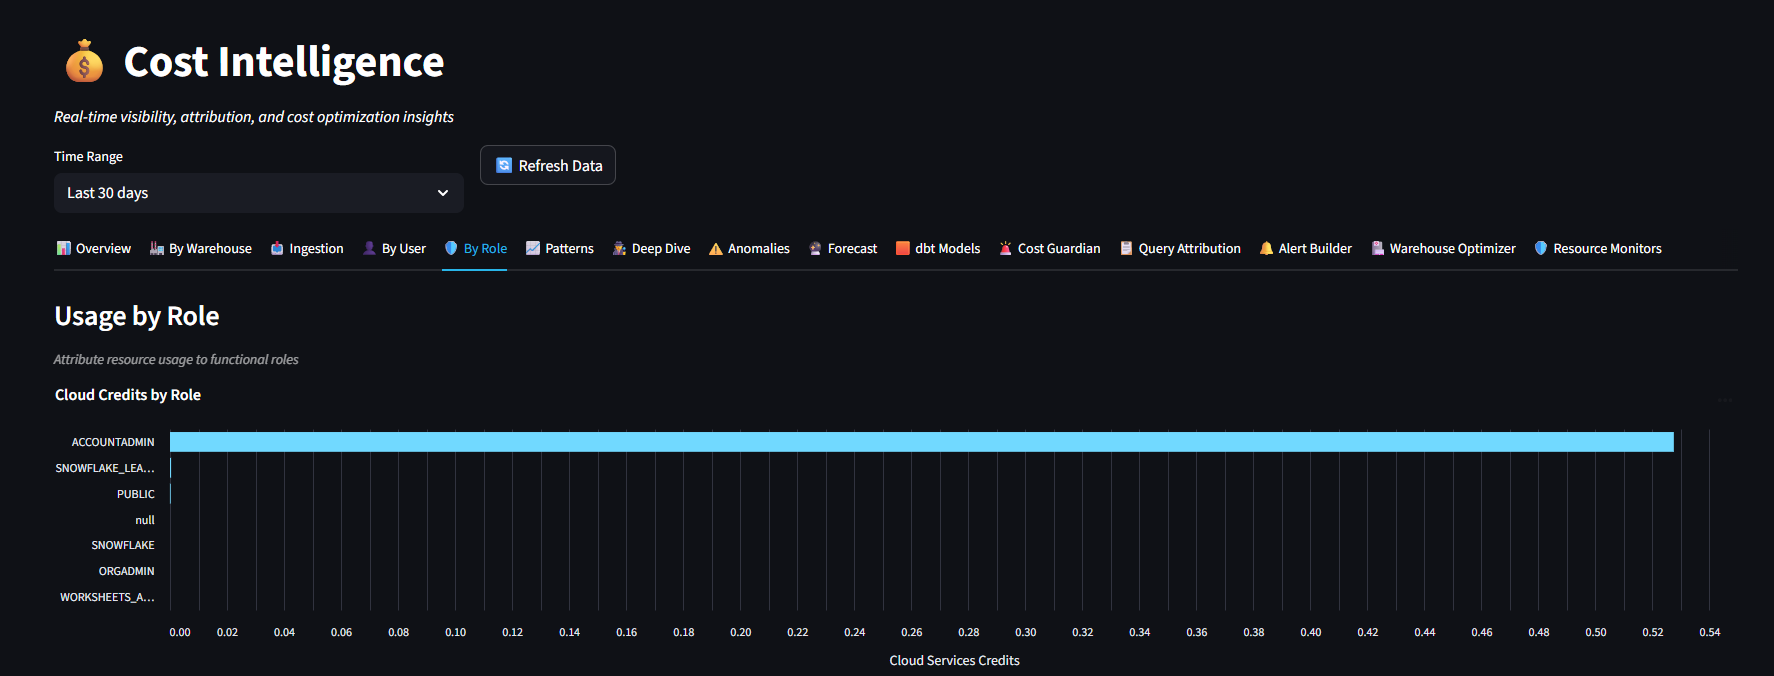
By Role — Cloud credits by role with ACCOUNTADMIN leading
Cost Forecast
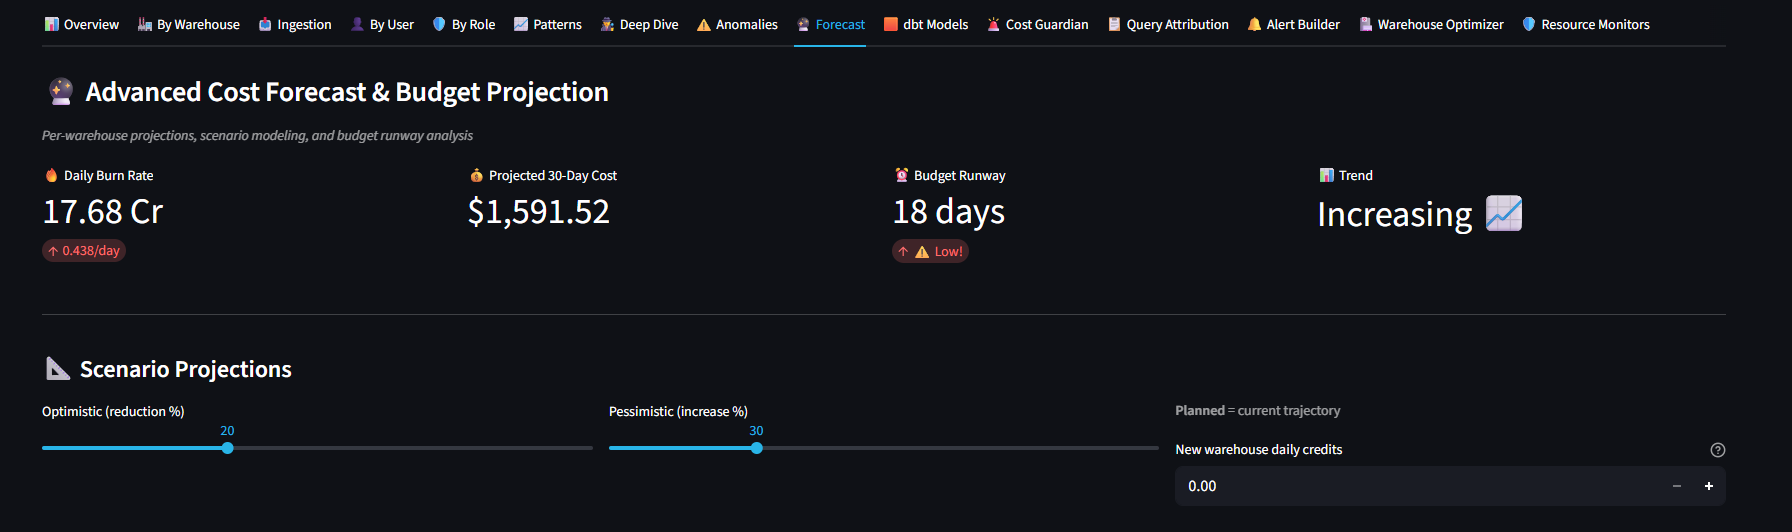
Forecast — 30-day projected cost $1,591, budget runway 18 days, scenario sliders

🚨 Cost Guardian

Real-time burst detection with automatic anomaly flagging and warehouse suspension controls.

  • Live warehouse status (started/suspended)
  • Credits per hour and today tracking
  • Hourly credit consumption with anomaly zones
  • Burst event log with Z-Score severity
  • Critical/Warning/Normal severity classification
  • Configurable anomaly thresholds
Cost Guardian
Live Status — 8 warehouses monitored, auto-suspend settings, credits per hour
Anomaly Detection
Anomaly Detection — Hourly credit chart with Critical (3x) and Warning (2x) zones, burst event log

⚡ Query Intelligence

Analyze, optimize, and track every query across your Snowflake account.

  • Most expensive queries by data scanned
  • Slowest queries with time breakdown
  • Failed query cost calculator
  • Query cost attribution with filters
  • Repeated query detection
  • Query pattern analysis
Query Intelligence
Expensive Queries — Top queries by GB scanned, filterable by time range
Slow Queries
Slow Queries — Execution/Compilation/Queue time breakdown, min 60s threshold
Failed Queries
Failed Query Calculator — 1,913 failed queries, $0.06 wasted, per-warehouse breakdown
Query Attribution
Query Cost Attribution — 100 queries, 15.27 credits, filter by user/warehouse/status

🔬 Deep Dive & Performance

Per-query cost attribution with SQL inspection and user performance scoring.

  • Per-query cost attribution table
  • Query inspector with full SQL text
  • User efficiency scores (0-100)
  • Fail rate, cache hit, spill analysis
Deep Dive Attribution
Deep Dive — Most expensive queries with user, warehouse, credits, and duration
User Scorecard
User Scorecard — Efficiency 85/100, fail rate, cache hit %, remote spill analysis
SQL Workbench
SQL Workbench — Full query detail with compile/execute time, queue wait, GB scanned
Query Performance
Query Performance — Top workloads by user with data scanned and credit usage

🏭 Warehouse Management

Health scoring, sizing recommendations, and performance optimization for every warehouse.

  • Health score per warehouse (0-100)
  • Credits used, fail %, avg queue time
  • Spill analysis and cache hit rate
  • Peak load and avg load monitoring
  • Benchmark & Savings tracking
  • Credit burn rate with budget projection
Warehouse Health Optimizer
Health Optimizer — Avg 78/100 health score, 9 warehouses scanned, color-coded health bars
Warehouse Metrics
Detailed Metrics — Credits, queries, fail %, queue time, spill, cache hit per warehouse
Benchmark Savings
Benchmark & Savings — Burn rate 10.3 cr/day, 348 remaining, 33 days until empty
Full Sidebar
Full Platform — Sidebar showing all 19+ modules and navigation

🛡️ Security Governance

CIS benchmark scoring, PII scanning, login forensics, and compliance auditing — all automated.

  • Security grade based on CIS Snowflake benchmark
  • Account admin count and policy monitoring
  • Network policy compliance checks
  • PII column scanner across databases
  • Login forensics and access auditing
  • Risk assessment with deduction breakdown
Security Scorecard
AI Security Scorecard — Grade B (80/100), CIS benchmark, 1 admin, 0 network policies (-20 deduction), compliance tabs

🔍 Data Observability

Track data access patterns, detect cold assets, monitor freshness, and ensure data quality.

  • Table access patterns with user attribution
  • Cold/unused asset detection with stale threshold
  • Data freshness monitoring
  • Schema drift alerts
  • Privacy guard and data quality checks
  • Last modified and hours-since-update tracking
Data Access Patterns
Access Patterns — 66 tables accessed, 3 users, 6,445 total queries, per-table breakdown
Cold Assets
Cold Assets — 80 tables, stale threshold slider, frozen/cold status, days idle tracking
Data Freshness
Data Freshness — Recent update chart with hours-since-update heatmap, per-table timeline

🔔 Alerts & Monitoring

Custom alert rules, webhook integrations, enforcement audit, and budget sentinel automation.

  • Custom metric trigger builder
  • Alert rules with conditions and thresholds
  • Webhook notifications (Slack/Teams/PagerDuty)
  • Budget enforcement audit trail
  • Active Budget Sentinel (background task)
  • Snowflake-native CREATE ALERT objects
Alert Builder
Alert Builder — How Alerts Work documentation, supported triggers, serverless compute
Alert Rules
Alert Rules — Define custom alerts with name, condition, threshold, notification channel
Enforcement Audit
Enforcement Audit — Budget enforcer actions (auto-suspend, query kill), sentinel status
Webhook Setup
Webhook Setup — Slack/Teams/PagerDuty webhook integration for automated notifications

Ready to take control?

Deploy in under 5 minutes. Open source and free to use.

Clone from GitHub Try Pro Free →